PHARMACOECONOMICS IN HEALTHCARE: MORE THAN DOLLARS
ANGEL A. RODRIGUEZ, PharmD, BCACP
Dr. Rodriguez is a clinical pharmacist from eastern Maryland. He is board- certified in ambulatory care pharmacy and has over 11 years of pharmacy experience in various roles, including ambulatory care, critical care, emergency medicine, and correctional medicine. Dr. Rodriguez’s clinical interests include endocrinology, psychology, cardiology, and pharmacoeconomics.
Topic Overview
Pharmacoeconomics is a type of outcomes research focusing on the economic impact or outcomes. Outcomes research is defined as measuring and evaluating the effect of healthcare interventions. Pharmacoeconomics primarily uses four analysis tools to evaluate the cost and outcomes of an intervention. These include cost-effectiveness analysis, cost-utility analysis, cost-benefit analysis, and cost-minimization analysis. Researchers of pharmacoeconomic studies are currently debating their models due to the differences in model structure, lack of standardization, and the potential need for disease-specific modeling. Future economic modeling for specific disease states will require evaluations to shift away from simplified models that do not reflect real-world scenarios, meaning there is a need for increased external validity.
Accreditation Statement

RxCe.com LLC is accredited by the Accreditation Council for Pharmacy Education (ACPE) as a provider of continuing pharmacy education.
Universal Activity Number (UAN): The ACPE Universal Activity Number assigned to this activity is
Pharmacist 0669-0000-23-167-H04-P
Pharmacy Technician 0669-0000-23-168-H04-T
Credits: 2 hours of continuing education credit
Type of Activity: Knowledge
Media: Internet/Home study Fee Information: $6.99
Estimated time to complete activity: 2 hours, including Course Test and course evaluation
Release Date: October 3, 2023 Expiration Date: October 3, 2026
Target Audience: This educational activity is for pharmacists.
How to Earn Credit: From October 3, 2023, through October 3, 2026, participants must:
Read the “learning objectives” and “author and planning team disclosures;”
Study the section entitled “educational activity;” and
Complete the Course Test and Evaluation form. The Course Test will be graded automatically. Following successful completion of the Course Test with a score of 70% or higher, a statement of participation will be made available immediately. (No partial credit will be given.)
Credit for this course will be uploaded to CPE Monitor®.
Learning Objectives: Upon completion of this educational activity, participants should be able to:
Define pharmacoeconomics
Explain how pharmacoeconomics is used in healthcare
Differentiate analytical tools used in pharmacoeconomics
Review the clinical effects of weighing the costs, benefits, and harms of healthcare interventions
Disclosures
The following individuals were involved in developing this activity: Angel A. Rodriguez, PharmD, BCACP, and Pamela Sardo, PharmD, BS. Pamela Sardo was an employee of Rhythm Pharmaceuticals until March 2022 and has no conflicts of interest or relationships regarding the subject matter discussed. There are no financial relationships relevant to this activity to report or disclose by any of the individuals involved in the development of this activity.
© RxCe.com LLC 2023: All rights reserved. No reproduction of all or part of any content herein is allowed without the prior, written permission of RxCe.com LLC.
Introduction
Pharmacoeconomics is a relatively new subset of economics in which researchers measure and value the outcomes of different healthcare interventions, including medications, medical procedures, medical devices, and many others. However, valuing healthcare interventions via pharmacoeconomic studies is not sufficient for real-world application and is typically combined with outcomes research. Outcomes from pharmacoeconomic research affect nearly every part of the pharmaceutical industry. The increasing national drug expenditure highlights the importance of pharmacoeconomics and outcomes research and rising healthcare costs year-over-year. This course discusses the four main analysis tools used to evaluate the cost and outcomes of medical interventions. After reviewing this CE, pharmacists and staff will be able to identify how they currently use the basics of pharmacoeconomics in their daily practice, improve their foundational understanding of pharmacoeconomics, and apply some of these evaluation methods to improve patient care.
Defining Pharmacoeconomics
Pharmacoeconomics researches the economic impact and outcomes of healthcare interventions. Outcomes research measures and evaluates the effect of healthcare interventions, while economics looks at the cost.1,2 The combination of pharmacoeconomics and outcomes research is often called Health Economics and Outcomes Research, or HEOR.1 Additionally, most pharmacoeconomic studies are HEOR studies since evaluating the costs of a healthcare intervention is only meaningful if the benefits of the healthcare intervention are evaluated and compared.2 Because economic outcomes alone may not directly translate to clinical practice, this CE will focus on the combination of HEOR and may use the terms pharmacoeconomics and HEOR interchangeably.
Why Pharmacoeconomics is Important
Outcomes from pharmacoeconomic research affect nearly every part of the pharmaceutical industry, including drug manufacturers, insurance companies, pharmacy benefits managers (PBMs), healthcare providers, and patients. Pharmacoeconomic outcomes may be used for communications between drug manufacturers and payers, may be used to approve or deny a therapy being placed on a formulary at the PBM or hospital level, or may even be used to communicate the potential cost benefit of a healthcare intervention to a patient.3 The vast impact of pharmacoeconomic outcomes on the pharmaceutical industry makes it essential for pharmacists to understand how pharmacoeconomic research is performed, how to interpret the study results, and how to apply those results to their practice site.
The most common example in which pharmacists may apply HEOR study results in practice is for pharmacy and therapeutics (P&T) meetings for a hospital or PBM. However, pharmacists in practically every setting apply HEOR study results to some degree, whether they know it or not. Simply put, when a pharmacist evaluates the cost and benefit of adding or removing a pharmacy service, they have done a pharmacoeconomic evaluation to some degree.4
Pharmacists may commonly perform what is known as partial economic evaluations in their daily practice. Partial economic evaluations are when the cost and consequence of one intervention are evaluated independently rather than by comparing it to another intervention. For example, a transitions-of- care pharmacist may recommend using an oral antibiotic covered by the patient’s insurance at discharge primarily because it will be affordable, improve adherence, and treat the underlying infection. This is an example of how pharmacists use derivatives of pharmacoeconomics daily. Partial evaluations can be expanded upon and become complete economic evaluations by adding a comparator intervention. Using the previous example, the pharmacist could make a complete economic analysis if the pharmacist compares the oral antibiotic to at least one other antibiotic that is covered by the patient’s insurance. This includes considering the relative efficacy of these
antibiotics using a local antibiogram or sensitivity analysis. The pharmacist will also compare the costs and adherence rates of each therapy before making a recommendation.5 There are many more examples of how pharmacists use pharmacoeconomic evaluations daily in their practice settings to better patient care.
A Brief History of Pharmacoeconomics
Pharmacoeconomics and health economics, as we know it today, evolved from traditional economics around 1980.6,7 The term pharmacoeconomics was first used in a Toronto pharmacists’ meeting and was defined as a study of cost and quality of life associated with new pharmacotherapies.7 The first health economists were trained in traditional economics and interested in healthcare. This means that economic tools like supply and demand were applied to healthcare. However, the need for better health economic tools became apparent as the movement of evidence-based medicine began in the 1980s. Evidence-based medicine effectively requires research to prove that one drug is better than another for health outcomes. With evolving health economics, drugs can be proven to have better economics.7
Since then, pharmacoeconomics has become a globally accepted science that evaluates healthcare interventions' cost, outcomes, and social aspects. It is still considered a young but growing science, with the number of pharmacoeconomic studies published growing exponentially yearly.6
The Importance of Pharmacoeconomic Research
Pharmacoeconomics can be useful in controlling the cost of medical services and medications. This is most significant within the context of treating specific diseases.
National Drug Expenditure
National drug expenditures are rising every year. A 10-year projection of national drug and healthcare expenditure expects costs to continue to increase yearly, affecting prescriptions, hospitals, and clinic visits.8,9 The national rise in drug costs highlights the importance of pharmacoeconomics and outcomes research and rising healthcare costs year-over-year.
In 2022, A review of the IQVIA National Sales Perspectives database was published in the American Journal of Health Systems Pharmacy to identify factors influencing healthcare spending and predicting growth in drug spending. The researchers found that 2021 pharmaceutical expenditures increased by 7.7% in the US compared to 2020, with a total expenditure of
$576.9 billion. Retail pharmacies accounted for 42.2% of total pharmaceutical expenditures, mail-order pharmacies accounted for 27.7%, clinics 18.2%, and nonfederal hospitals 6.9%. The main factors driving the increased cost of drugs were increased drug utilization, drug prices, and the introduction of new drugs, with increased drug utilization (increased drug volume or mix) being the primary driver.10 The top three medications for overall expenditures were adalimumab, apixaban, and dulaglutide. The top drug therapeutic categories for total expenditure in nonfederal hospitals included antineoplastic agents, antiviral drugs, immunologic agents, biologics, and hemostatic modifiers.10 Table 1 describes these expenditures.
Table 1: Top 3 Drugs by Expenditures Overall in 2021
| Drug | 2021 Expenditures ($ thousands) | Percent change from 2020 |
| Adalimumab | 28,498,153 | 14.6 |
| Apixaban | 15,795,250 | 23.2 |
| Dulaglutide | 12,198,284 | 40.2 |
For total healthcare expenditure, an increase of 9.5% was seen in 2020 to a total of $4.1 trillion. Additionally, the gross domestic product 9GPD dropped by nearly 20% during that time.10,11 However, the data from 2020 to today is heavily influenced by the global COVID-19 pandemic. The rate at which the national healthcare expenditure would increase yearly from 2014 to 2019 was between 4.3% and 5.4%. The expenses affected were health consumption expenditures, federal insurance, third-party payers, and public health activity.11 Total healthcare expenditure increased by 2.7% for 2021 and was a lower rate of increase primarily due to decreased federal pandemic expenditures.8 This data helps to highlight the importance for pharmacists and healthcare providers to understand better medication expenditures and how they may apply their knowledge of HEOR to decrease their local expenditures.
Disease-specific Expenditure Example
Understanding national expenditure data may not be as applicable to daily practice as understanding a disease’s economic impact. Diabetes is one of the most common diseases nationally and globally. It has a significant economic impact by affecting medical costs, loss of productivity, increased mortality, and intangible costs of reduced quality of life.12,13 In 2018, the American Diabetes Association reported that the total estimated cost of diagnosed diabetes in the United States was $327 billion. Of that, $237 billion was associated with direct medical costs, and $90 billion was associated with reduced productivity. Prescriptions for antihyperglycemic medications, insulin, insulin supplies, and other diabetes equipment costs were estimated to be nearly $107 billion.13 This cost data highlights an area for pharmacists to apply their knowledge of pharmacoeconomics not only to decrease the direct medical costs of their patients but also to improve patient outcomes by aiding in medication optimization and adherence outreach. Figure 1 illustrates both components of costs and outcomes.

Cost

Benefits/ Outcomes
Figure 1: Pharmacoeconomics Examines Costs and Benefits or Outcomes
Analytical Tools Used in Pharmacoeconomics
Pharmacoeconomics primarily uses four analysis tools to evaluate the cost and outcomes of an intervention. These include Cost-effectiveness Analysis, Cost-utility Analysis, Cost-benefit Analysis, and Cost-minimization analysis.5,14
Cost-Effectiveness Analysis
A cost-effectiveness analysis (CEA) is one of the most common pharmacoeconomic evaluation methods used in healthcare.5 They are used as a way to evaluate the costs and outcomes of one or more interventions and report their outcomes as a cost-per-unit-gained of a health outcome. They may also be reported as life-year gained or death prevented.5,15 CEAs are commonly mistaken or used synonymously with cost-utility analyses, which will be discussed next. However, the main difference between the two is that cost-utility analyses report their outcomes in changes in derivatives of morbidity or mortality, and CEAs use varying health outcomes depending on the interventions being evaluated.5 CEAs can be adaptable depending on the outcome and costs wanting to be measured and can include broad or narrow cost parameters depending on the desired level of external validity.16
For example, a rural, critical-access hospital wants to compare the direct medical costs of discharging patients on either warfarin or apixaban at a 90- day follow-up period. They want to evaluate the medication adherence rate at a 90-day follow-up between the two medication groups and use that as a marker for treatment success. While national data may already exist comparing the two medications for cost and outcomes, that data may not match the patient population that this hospital typically treats. Their rural setting may also experience different direct medical costs that the hospital wants to investigate and compare to their adherence outcomes.
This hospital’s CEA would be an example of a CEA that has narrow inclusion criteria for cost and outcomes that may not have strong external validity but have the potential to be impactful for their practice setting and their patients.
For another example, an ambulatory pharmacist wants to evaluate the efficacy of a new outreach service on attendance for a diabetes management class. They want to measure the cost of having an employee make outreach phone calls and compare it to the number of patients that arrive at the classes. The total cost of outreach would be compared to a potential increase in attendance by “X cost per 1 extra person attending class.”15 If the cost improvement of having a patient attend the class is already known, this would be a simple example of how a quick and site-specific CEA could improve patient outcomes and costs.
Benefits and Limitations: A CEA's main benefit is that the outcomes tend to be easy for clinicians to understand without a pharmacoeconomics background. They use clinically relevant outcome measures and cost data that generally make sense to those in clinical practice. The cost and health outcomes are typically directly related to a societal value, meaning the costs of improved health outcomes are directly related to established treatment goals for whichever disease or intervention is being evaluated. A major limitation to CEAs is that the indirect medical costs evaluated may never truly reflect the costs associated with an intervention in a real-world setting. Direct
costs are easy to identify, but indirect costs can vary depending on the socioeconomic status of the patients evaluated, the setting of the practice site, or the resources available to patients, such as grants or community services.5,16 Table 2 provides a hypothetical CEA example.
Table 2: Hypothetical Cost-Effectiveness Analysis in Drug Therapy
| Cost of Therapies ($) | ||
| COSTS ($) | DRUG A | DRUG B |
| Acquisition cost | $300 | $400 |
| Administration cost | $50 | $0 |
| Monitoring cost | $50 | $0 |
| Adverse effects cost | $100 | $0 |
| SUBTOTAL | $500 | $400 |
| OUTPUTS | ||
| Extra years of life | 2 | 1.5 |
| Cost-effectiveness ratio | 500/2 = 250 | 400/1.5 = 266.6 |
| Cost per extra year of life | ||
Cost-Utility Analysis
A cost-utility analysis (CUA) is a commonly used pharmacoeconomic evaluation method in which the incremental cost of two or more interventions is compared to the incremental improvement in health status.5,16 Health status outcomes for CUAs are reported as quality-adjusted life years (QALYs) or disability-adjusted life years (DALYs).5,17 Although technically different, CUAs and CEAs tend to be used synonymously in literature, and studies published claiming to be CEAs may report their outcomes as QALYs or DALYs.5,17 Since the two evaluations are similar, the most important aspect is that both evaluation methods compare and analyze the costs and outcomes associated with healthcare interventions, or in the case of CUAs, cost-per-QALY.
Benefit/limitations: The reported outcomes of CUAs as QALYs and DALYs are not easily understood by working clinicians unless they have a good baseline understanding of pharmacoeconomics.18 Meaning CUAs may lack the
applicability to real-world scenarios compared to CEAs. In fact, the use and meaning of QALYs are debated among practicing pharmacoeconomics today. Some consider QALYs to restrict outcome measurements and make it difficult to conceptualize the benefits, while others think that QALYs allow for the useful standardization of CUAs despite potential limitations.5,19 Better comparison between CUAs allows for more homogeny of reported outcomes, which may lead to more applicability to real-world scenarios.
What is a QALY?
The interpretation of CUAs relies on understanding how to interpret a QALY. A QALY is a utility measure, a type of incremental cost-effectiveness ratio (ICER), used to account for the quality of life and survival of a given intervention.16 QALYs are used as a standardized measure for CUAs, but QALYs themselves can be calculated in different ways depending on the perspective of a study or the opinions of the researchers. As with most attempts at making a standardized measure, QALYs are not a perfect measurement and may overestimate or underestimate the value of an intervention. Despite not being a perfect measure, the interpretation of a QALY and cost-per-QALY should be done individually. Specifically, the cost-per- QALY’s impact is greatly influenced by the disease state being evaluated.16,17 For example, is the cost-per-QALY for a new chemotherapy agent for a previously untreatable cancer $250,000 per QALY appropriate? How about a new antihypertensive with a cost-per-QALY of $75,000? The willingness-to- pay and cost-per-QALY can change depending on the disease state and how saturated the treatment space is. For the previous examples, the chemotherapy agent may be the easiest and best choice of the two. But what if a patient has resistant hypertension while currently on four antihypertensive medications? Would a cost-per-QALY of $75,000 for a new antihypertensive meet a willingness-to-pay for that patient?
QALYs are imperfect but are a great step in standardizing the complicated data of costs and health outcomes. QALYs are also the most used utility measure in the United States, but not worldwide. Most countries do not
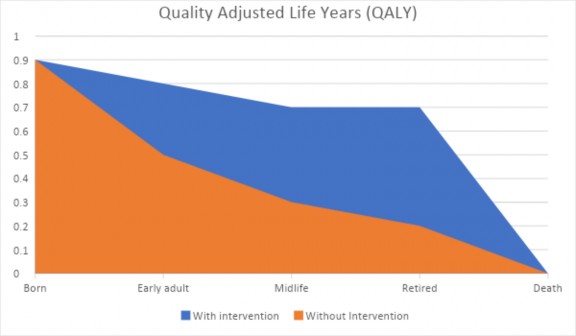
use QALYs and instead use other types of ICERs. In a study comparing two interventions, an ICER is simply calculated as “Cost (treatment 2) – Cost (treatment 1) / Effectiveness (treatment 2) – Effectiveness (treatment 1).” Or written in plain language, ICER is the net incremental cost of gaining an incremental health benefit of one therapy over another therapy. ICERs also help to set a willingness to pay, and typically, national organizations set a standard willingness-to-pay threshold.16 Figure 2 illustrates a hypothetical QALY example.
Figure 2: Hypothetical QALY for Two Individuals, With and Without an Intervention
Cost-Benefit Analysis
A cost-benefit analysis (CBA) is a pharmacoeconomic tool in which the costs and consequences are measured and reported in monetary units.16 The health outcomes that may be reported as QALYs or disease-specific improvements in CUAs and CEAs are instead converted to a monetary value in CBAs, allowing for reporting to be the net monetary cost of obtaining a certain health outcome.5,16 In plain language, CBAs tend to be simplified studies that evaluate the potential cost savings for every dollar spent. For
example, a hospital may want to know how much it has saved by decreasing heart failure readmission rates in the last year after implementing three new initiatives to reduce readmissions. They may simply look at the overall costs of starting the initiatives and compare that to the amount they saved on heart failure readmissions. This information may not answer specifically which initiative was more effective, but it is useful for obtaining and reporting cost data quickly.
Benefit/limitations: In today’s evidence-based healthcare system, CBAs are not typically used because they are measured and reported in monetary units: i.e., they do not report a balance of costs and outcomes like CUAs and CEAs and may not be the best at differentiating between the benefits of different interventions. However, CBAs do benefit from the fact that their use is more consistent with how other industries report their cost data and can be understood more easily at the executive level than CEAs and CUAs.5,16
Cost-Minimization Analysis
A cost-minimization analysis (CMA) is a pharmacoeconomic evaluation tool in which the costs of two or more interventions that are considered to be therapeutically equivalent are compared. 5 In many cases, CMAs are not done on a large scale or published in scientific journals but instead may be done quickly. They are a major benefit to local practice sites like hospitals and pharmacies.16 In plain language, CMAs are often the most performed pharmacoeconomic evaluation done by pharmacists and clinicians, even without knowledge of pharmacoeconomics. For example, a pharmacist in either a community or hospital setting may be deciding between adding omeprazole or esomeprazole to their formulary as the initial preferred proton pump inhibitor. They determine that the two medications are effectively therapeutically equivalent, and whichever one they can acquire for a lower cost (after accounting for price and rebates) will be the one they give preferred status on their formulary.
A CMA is also a great model that pharmacy technicians can apply to their practice settings. Technicians working as pharmacy buyers are some of the first people in a hospital or community setting to receive information about which medications are available, on allocation, or backorder. For example, if cetirizine went on allocation or backorder, but levocetirizine and loratadine are readily available at differing prices, they can use the methodology of a CMA quickly to compare the recommended therapeutic alternatives and their acquisition costs and present the comparative information to their pharmacist to confirm which alternative may be better to purchase. While this may seem like standard operations for some technicians, it exemplifies how partial pharmacoeconomic evaluations are used daily in pharmacy practices.
Benefits/limitations: CMA's main benefits are that they can be quick and easy to perform and have relatively no cost compared to other evaluation methods. However, because true equivalency studies are uncommon, assumptions must be made before CMAs can be performed. Because of this, CMAs are not commonly done at a macro level but instead offer a significant benefit to individual practice sites based on their individual cost data.20
Determining Cost Parameters
Most pharmacoeconomic studies, like CEAs and CUAs, will set various cost parameters to help establish their reasoning for certain costs. A time horizon sets the durations over which the costs and outcomes will be calculated. Based on that time horizon, discounting may need to happen to account for inflation, rebates, or other factors relevant to the interventions. Willingness to pay is set as a cost target in which the researchers believe an individual may be willing to pay for an intervention’s improved health outcomes. Lastly, the direct costs, indirect costs, and intangible costs that are included will be specified so that there is uniformity of cost data between the interventions. Specification of the included costs also allows for potential comparisons across studies that include similar costs.4
Applying HEOR in Practice
Applying large pharmacoeconomic study results to an individual’s practice site first requires the ability to interpret the study results. To do that, first identify what type of evaluation it was (CEA, CUA, CBA, CMA, etc.) to understand what the goal of the study is. For example, if the study was a CEA, the goal is to compare costs and health outcomes of multiple interventions, ideally finding that one has a better cost-improvement ratio. If the study is a CMA, then the outcome will be simply to determine which intervention has lower costs, but those costs may include direct, indirect, and intangible costs, which may not directly apply to one’s individual practice setting.
Another consideration that should be made is that direct medication costs can be different depending on the individual practice site, and in general, medication costs are lower in clinical practice than they are in study settings.21 Because of this, there is no “one-size-fits-all” model for applying pharmacoeconomic study results to clinical practice. Instead, it requires an understanding of one’s individual costs at their practice site and adapting and utilizing study results that may not perfectly match an individual’s scenario. Opportunity cost is an additional consideration. It is an economics term that refers to the loss of potential benefits from other options when one option is chosen. Opportunity cost of investing in a healthcare intervention is best measured by the health benefits.
Clinical Efficacy vs. Drug Cost
Discussions for improving cost-effective prescribing habits have been ongoing for decades.22-24 Barriers to improving cost-effective prescribing include changes in CEA study perspectives, differences in willingness to pay based on the disease state, and ethical considerations providers and pharmacists have to make on an individual basis.24 For example, a pharmacist working in an oncology clinic may want to recommend a specific chemotherapy agent for a patient that meets the exact use criteria, but the patient’s insurance denies its use because it is not a cost-effective medication.
Is the insurance wrong? The insurance is likely using large HEOR data to make their formulary decisions, while the pharmacists and clinicians in the oncology clinic are attempting to make cost-effective decisions on an individual level.
Another barrier to cost-effective prescribing is the excitement for new medications and the difference between statistical and clinical significance.25,26 As new medications enter the market, there is understandable excitement for what health improvements those new medications may offer patients. This excitement leads to higher prescribing rates for new medications and is directly associated with rising medication costs at rates greater than annual inflation.25 One method with which to balance increased prescribing of new medications is to be able to differentiate between a new medication’s statistically significant outcomes observed in clinical trials and the potential clinical significance often not calculated in said trials. Statistical significance is defined as the difference seen in the study populations, and clinical significance is defined as the applicability of the statistically significant results to the general population.27 In other words, statistical significance is important for a study’s internal validity, and clinical significance is important for a study’s external validity. There are several biostatistical methods with which clinical significance can be calculated, but we may also be able to use critical thinking to determine it as well.28 For example, let's say that the average rate of asthma exacerbations for standard inhaler therapy is 5%. A pharmaceutical company just completed a phase-3 trial for their new inhaler and reports that their inhaler showed a statistically significant decrease of 20% in the rate of asthma exacerbations compared to standard inhaler therapy. Does this sound clinically significant as well? Well, a 20% decrease of the 5% rate would mean this new inhaler has an exacerbation rate of 4%. This example, and the questioning of clinical significance, is the start of a complete pharmacoeconomic analysis. However, some other questions are needed to explore the clinical significance completely. How many patients should be treated per year to see a decrease in exacerbation rate? What is the cost difference between the new inhaler and the standard inhaler therapy? Does this benefit apply to patients not matching the inclusion criteria of the phase- 3 study?
Thankfully, the level of this kind of pharmacoeconomic analysis does not need to be done at individual sites since there are large organizations that specialize and publish their full pharmacoeconomic analyses. One such organization is the Institute for Clinical and Economic Review (ICER), not to be confused with the previously used acronym “ICER,” which stands for “incremental cost-effectiveness ratios.” The Institute for Clinical and Economic Review is a US-based organization that uses comparative clinical effectiveness research to weigh the costs, benefits, and harms of healthcare interventions from multiple perspectives. Their research is published on their website as a free resource.29 The National Institute of Health and Care Excellence (NICE) is a UK-based organization that publishes research similar to ICER in the US but also publishes general practice guidelines, the British National Formulary (BNF), public health recommendations, and other health-related communication articles for free on their website.30
Formulary Management and Study Perspectives Formulary Management
Medication formulary management is a commonly used pharmacoeconomic evaluation tool. Formulary committees, such as pharmacy and therapeutics (P&T) committees, may use pharmacoeconomic data that is specific to the site, such as partial evaluations of local costs and health outcomes specific to their patient population, phase-3 clinical trial data, large evaluations from ICER, or even data from observational studies to help determine which medications will be on their formulary.31 Recently, the use of pharmacoeconomics for formulary committees has become more important with the increase of biologics and biosimilars on the market. The evaluations for biologics and biosimilars have become more in-depth due to the nature of value-based reimbursements, bundled payment models, and increased scrutiny of medication use for inappropriate indications.32
Study Perspectives
Pharmacoeconomic evaluations are required to have a specific perspective. These include societal, clinician, patient, and third-party payer perspectives. A study perspective is important because it considers who pays the cost of the intervention and who receives the benefit. Societal and payer perspectives are the most commonly used perspectives since they are the parties most commonly concerned with costs associated with health outcomes. The societal perspective is the broadest and can include direct, indirect, and intangible costs that affect healthcare as a whole. The payer perspective is important for third-party payers because they are concerned with the direct costs they are responsible for, and in a healthcare environment moving away from fee-for-service, payers want to see improved health outcomes associated with their costs. Countries with national health insurance may be interested in studies from both societal and payer perspectives.4,33 Figure 3 illustrates perspectives in pharmacoeconomics.

Patient Perspective
Provider Perspective
Payer Perspective
Societal Perspective
Figure 3: Perspectives in Pharmacoeconomics
The patient’s perspective is important for understanding the direct, indirect, and intangible costs a patient may be responsible for, and when compared with health outcomes, helps to determine a willingness to pay for patients. Patient perspectives may focus more on copays, co-insurance, and
indirect medical costs than payer perspectives, which may focus on total medication costs. Copays can be considered a direct medical cost and a direct pharmacy cost. Lastly, clinician or provider perspectives are important for hospitals, pharmacies, and clinics as they focus on the costs associated with performing certain interventions, the acquisition of materials, the health outcomes, and potentially the cost savings of one intervention over another.4,33 Figure 4 illustrates previously discussed cost examples in pharmacoeconomics.

Direct Medical Cost
Indirect Cost
Direct Pharmacy Cost
Opportunity Cost
Intangible Cost
Figure 4: Costs in Pharmacoeconomics
Pharmacist-led Case Examples Community Pharmacist Example
The owner of an independent pharmacy and their lead technician want to investigate two different methods of improving prescription refill adherence for patients with asthma and COPD. Both methods are refill-alert systems; however, one is fully automated, while the other is an automatically generated list that requires the technician to call the patients on the list to discuss their refills. They have determined through an analysis of their refill data that refill adherence for inhalers is 65%, meaning they are missing out on 35% of their
potential fills and revenue for inhalers, as well as exposing their non-adherent patients to a potentially increased risk of asthma/COPD exacerbations. The team decided to divide the patients with missing refills evenly into two groups so they could evaluate and compare the costs associated with each method and the outcomes each method has on refill adherence over the next six months. The direct costs associated with the two methods are the cost of staffing and the cost of the software. The outcome being compared is the percent of improved refill adherence and the lost revenue recovered by each method.
While this is an example of a partial economic analysis, it is one that pharmacists and technicians in the community setting do regularly. These types of analysis can be expanded upon by utilizing some of the previously mentioned parameters, like adding different perspectives and different time horizons, evaluating a willingness to pay, and investigating other barriers to refill adherence.
Hospital Pharmacist Example
The most common use of pharmacoeconomics in a hospital setting is in pharmacy and therapeutics (P&T) committee meetings for formulary management.34 However, the recent COVID-19 pandemic required pharmacists to utilize pharmacoeconomics quickly to adapt to the rapidly changing healthcare landscape during that time. Pharmacists experienced how quickly preferred therapy options can change during the COVID-19 pandemic. Hospital medication costs from 2019 to 2021 increased significantly by 36.9% and accounted for the largest growth of hospital expenses during that time.35 Pharmacists and healthcare providers who are knowledgeable of pharmacoeconomics and how to apply the different evaluation methods can have on health outcomes and cost savings, and the pandemic was a prime example of the need for pharmacoeconomic evaluations.
The pharmacist's role in managing drug shortages includes designing evidence-based treatment guidelines that include alternative medications so they can be adaptable to drug shortages, advocating for accurate prescribing and use of certain medications, creating approval procedures for restricted use medications, designing medication use algorithms to conserve medications that are on backorder or at risk of going on backorder and evaluate costs associated with medication alternatives when shortages occur.36
One example of medications that were in significant shortage were medications used for rapid sequence intubation (RSI) and anesthesia, such as midazolam, cisatracurium, dexmedetomidine, etomidate, propofol, vecuronium, and fentanyl. The order in which these medications are listed is the order in which they were reported to be on back order, highlighting a domino effect of drug shortages increasing the utilization of other medications in a similar therapeutic class and subsequently causing those medications to go on backorder.37 While therapeutic considerations would have been at the forefront of deciding which replacement medication would be best, the cost of acquisition would have certainly played a factor, and pharmacists would have needed to use their clinical knowledge to evaluate the differences between the available RSI medication and how they would be able to implement them into their workflow, all while considering the costs and availability of each option. This would more so be an example of a partial economic analysis, but one that is more than appropriate in this scenario due to the speed at which decisions are needed to be made and the information available at the time.
The Future of Pharmacoeconomics
Researchers of pharmacoeconomic studies are currently debating the uncertainty of their models due to the differences in model structure, lack of standardization, and the potential need for disease-specific modeling.38,39 Future economic modeling for specific disease states will require evaluations to shift away from simplified models that do not reflect real-world scenarios, meaning there is a need for increased external validity.40 One such disease-
specific model or therapy-specific model that will benefit greatly from standardizing the economic model is gene therapies. Gene therapies challenge traditional pharmacoeconomic models because they have relatively small patient populations, are often single-dose therapies, and have high upfront costs with undetermined long-term benefits. Traditional use and interpretation of QALYs may not apply to gene therapies and may require the creation of gene-therapy-specific pharmacoeconomic models.41 However, even with improved models, it is important for pharmacists to be still able to interpret pharmacoeconomic study results and be able to differentiate between what may be cost-effective care for a specific population and what quality care may be for an individual patient.40,42
While this CE did not discuss in depth the role of pharmacy benefit managers (PBMs) in the healthcare model, they are one of the largest industries that utilize HEOR for formulary management and payer functions. However, they have faced increased scrutiny from pharmacists and State and Federal governments for their business practices. As such, there have been several State-level regulations imposed on PBMs to increase the regulation of their practices, as well as the Federal government pushing for more sweeping regulating legislation such as the PBM Transparency Act of 2022.43,44
Summary
Pharmacoeconomics measures and values the outcomes of different healthcare interventions, including medications, medical procedures, medical devices, and many others. Valuing healthcare interventions via pharmacoeconomic studies is typically combined with outcomes research. The four main analysis tools used to evaluate the cost and outcomes of medical interventions are cost-effectiveness analysis, cost-utility analysis, cost-benefit analysis, and cost-minimization analysis. Outcomes from pharmacoeconomic research affect nearly every part of the pharmaceutical industry. The annual increase in national drug expenditures and healthcare costs highlights the importance of pharmacoeconomics and outcomes research.
Course Test
Pharmacoeconomics and HEOR were developed from traditional economic tools primarily for what reason?
To provide a clinical risk-benefit analysis
So hospitals can charge the maximum for their services
To help measure the economic outcomes of healthcare interventions
To evaluate the costs of a healthcare intervention without considering its benefits
Which of the following is one of the more common uses of pharmacoeconomic/HEOR research for hospitals and pharmacy benefit managers?
Outpatient medication prescribing
Formulary management
Gathering real-world data on healthcare interventions
Antibiotic Stewardship
Which of the following pharmacoeconomic tools used QALYs or DALYs as its outcomes reporting measure and compares incremental cost and incremental improvements of healthcare interventions?
Cost-effectiveness Analysis
Cost-utility Analysis
Cost-benefit Analysis
Cost-minimization Analysis
In today’s evidence-based healthcare system, analysis is not typically used because it measures and reports in monetary units and does not balance costs and outcomes.
cost-effectiveness
cost-utility
cost-benefit
cost-minimization
Which of the following pharmacoeconomic tools is the most commonly used tool because it evaluates the cost and outcomes of healthcare interventions and reports the outcomes as cost-per- unit-gained?
Cost-effectiveness Analysis
Cost-utility Analysis
Cost-benefit Analysis
Cost-minimization Analysis
Which of the following pharmacoeconomic tools can be quickly performed, can assume therapeutic equivalence between the evaluated interventions, and can have a significant impact on local practice site decision-making?
Cost-effectiveness Analysis
Cost-utility Analysis
Cost-benefit Analysis
Cost-minimization Analysis
True or False: Pharmacy technicians can use cost-minimization Analyses to benefit their practice setting by quickly assessing cost trends and recommending the purchase of cheaper therapeutic alternatives.
True
False
True or False: Medication costs are lower in clinical practice than they are in study settings, which requires a “one-size-fits-all” model to match individual scenarios.
True
False
Pharmacoeconomics uses specific perspectives - societal, clinician, patient, and third-party payers. The perspective is the broadest since it evaluates direct, indirect, and intangible costs that affect healthcare as a whole.
patient
third-party
clinician
societal
Which statement below is true about pharmacoeconomic costs?
Direct costs are impossible to identify and are hidden in bills
Indirect costs can vary depending on a patient's socioeconomic status
Opportunity costs occur when a patient is deceased
Medical and pharmacy copays are examples of intangible costs
References
ISPOR. About HEOR: Interest in the field of health economics and outcomes research (HEOR) has grown exponentially. Updated 2023. https://www.ispor.org/heor-resources/about-heor. Accessed July 12, 2023.
Mukherjee K. Pharmacoeconomics and Outcomes Research: Helping make informed health decisions. Updated 25 Jan 2023. https://www.pcom.edu/academics/programs-and-degrees/doctor-of- pharmacy/school-of-pharmacy/blog/pharmacoeconomics-and- outcomes-research.html. Accessed July 6, 2023.
Miller P. Role of Pharmacoeconomic analysis in R&D decision making: when, where, how? Pharmacoeconomics. 2005;23(1):1-12. doi:10.2165/00019053-200523010-00001
Tonin F, Aznar-Lou I, Pontinha V, Pontarolo R, Fernandez-Llimos F. Principles of pharmacoeconomic analysis: the case of pharmacist-led interventions. Pharm Pract (Grananda). 2021;19(1):2302. doi:10.18549/PharmPract.2021.1.2302
Turner HC, Archer RA, Downey LE, et al. An Introduction to the Main Types of Economic Evaluations Used for Informing Priority Setting and Resource Allocation in Healthcare: Key Features, Uses, and Limitations. Front Public Health. 2021;9:722927. Published 2021 Aug 25. doi:10.3389/fpubh.2021.722927
Grega D, Kolar J. Historical analysis of pharmacoeconomic terms. Scientometrics. 2019;119(3):1643-54. doi: doi.org/10.1007/s11192- 019-03093-0
Mauskopf JA. Why study pharmacoeconomics?. Expert Rev Pharmacoecon Outcomes Res. 2001;1(1):1-3. doi:10.1586/14737167.1.1.1.
National Health Expenditure Data. Centers for Medicare & Medicaid Services. Updated 15 Dec 2022. https://www.cms.gov/Research- Statistics-Data-and-Systems/Statistics-Trends-and- Reports/NationalHealthExpendData. Accessed June 5, 2023.
Keehan SP, Fiore JA, Poisal JA, et al. National Health Expenditure Projections, 2022-31: Growth To Stabilize Once The COVID-19 Public Health Emergency Ends. Health Aff (Millwood). 2023;42(7):886-898. doi:10.1377/hlthaff.2023.00403
Tichy EM, Hoffman JM, Suda KJ, et al. National trends in prescription drug expenditures and projections for 2022. Am J Health Syst Pharm. 2022;79(14):1158-1172. doi:10.1093/ajhp/zxac102
Hartman M, Martin AB, Washington B, Catlin A, The National Health Expenditure Accounts Team. National Health Care Spending In 2020:
Growth Driven By Federal Spending In Response To The COVID-19 Pandemic. Health Aff (Millwood). 2022;41(1):13-25. doi:10.1377/hlthaff.2021.01763
Seuring T, Archangelidi O, Suhrcke M. The Economic Costs of Type 2 Diabetes: A Global Systematic Review. Pharmacoeconomics. 2015;33(8):811-831. doi:10.1007/s40273-015-0268-9
American Diabetes Association. Economic Costs of Diabetes in the U.S. in 2017. Diabetes Care. 2018;41(5):917-928. doi:10.2337/dci18-0007
Chapter 9. Principles of Pharmacoeconomics. In: Waning B, Montagne
M. eds. Pharmacoepidemiology: Principles and Practice. McGraw Hill; 2001.
https://accesspharmacy.mhmedical.com/content.aspx?bookid=438&sec tionid=40428530. Accessed September 26, 2023.
Centers for Disease Control and Prevention. Cost-Effectiveness Analysis. CDC. Updated 20 Oct 2021. https://www.cdc.gov/policy/polaris/economics/cost- effectiveness/index.html#:~:text=Cost%2Deffectiveness%20analysis% 20is%20a,gained%20or%20a%20death%20prevented. Accessed September 26, 2023.
Rai M, Goyal R. Chapter 33 - Pharmacoeconomics in Healthcare. Pharmaceutical Medicine and Translational Clinical Research. 2018:465-
472. doi:https://doi.org/10.1016/B978-0-12-802103-3.00034-1
Neumann PJ, Anderson JE, Panzer AD, et al. Comparing the cost-per- QALYs gained and cost-per-DALYs averted literatures. Gates Open Res. 2018;2:5. Published 2018 Mar 5. doi:10.12688/gatesopenres.12786.2
Augustovski F, Colantonio LD, Galante J, et al. Measuring the Benefits of Healthcare: DALYs and QALYs - Does the Choice of Measure Matter? A Case Study of Two Preventive Interventions. Int J Health Policy Manag. 2018;7(2):120-136. Published 2018 Feb 1. doi:10.15171/ijhpm.2017.47
Wichmann AB, Adang EM, Stalmeier PF, et al. The use of Quality- Adjusted Life Years in cost-effectiveness analyses in palliative care: Mapping the debate through an integrative review. Palliat Med. 2017;31(4):306-322. doi:10.1177/0269216316689652
Newby D, Hill S. Use of pharmacoeconomics in prescribing research. Part 2: cost-minimization analysis--when are two therapies equal?. J Clin Pharm Ther. 2003;28(2):145-150. doi:10.1046/j.1365- 2710.2003.00455.x
Gandjour A. A model to transfer trial-based pharmacoeconomic analyses to clinical practice. Pharmacoeconomics. 2011;29(2):97-105. doi:10.2165/11584220-000000000-00000
Freemantle N, Henry D, Maynard A, Torrance G. Promoting cost effective prescribing. BMJ. 1995;310(6985):955-956. doi:10.1136/bmj.310.6985.955
Smith S. Cost-Effective Prescribing. AMA Journal of Ethics. 2002;4(11)doi:10.1001/virtualmentor.2002.4.11.puhl1-0211
Kim DD, Basu A. How Does Cost-Effectiveness Analysis Inform Health Care Decisions? AMA Journal of Ethics. 2021;23(8):E639-647. doi:10.1001/amajethics.2021.639
Hernandez I, Good CB, Cutler DM, Gellad WF, Parekh N, Shrank WH. The Contribution Of New Product Entry Versus Existing Product Inflation In The Rising Costs Of Drugs. Health Aff (Millwood). 2019;38(1):76-83. doi:10.1377/hlthaff.2018.05147
Sharma H. Statistical significance or clinical significance? A researcher's dilemma for appropriate interpretation of research results. Saudi J Anaesth. 2021;15(4):431-434. doi:10.4103/sja.sja_158_21
Sedgwick P. Clinical significance versus statistical significance. BMJ.
2014;348:g2130. doi:10.1136/bmj.g2130
Khorsan R, Crawford C. How to assess the external validity and model validity of therapeutic trials: a conceptual approach to systematic review methodology. Evid Based Complement Alternat Med. 2014;2014:694804. doi:10.1155/2014/694804
Institute for Clinical and Economic Review: Who We Are?. ICER. 2023. https://icer.org/who-we-are/history-impact/. Accessed October 2, 2023.
National Institute for Health and Care Excellence. NICE. 2023. https://www.nice.org.uk/about/who-we-are/history-of-nice. Accessed October 2, 2023.
Vogenberg FR, Gomes J. The changing roles of p&t committees: a look back at the last decade and a look forward to 2020. P T. 2014;39(11):760-772.
Studdert AL, Gong CL, Srinivas S, Chin AL, Deresinski S. Application of pharmacoeconomics to formulary management in a health system setting. Am J Health Syst Pharm. 2019;76(6):381-386. doi:10.1093/ajhp/zxy010
Oderda GM. The importance of perspective in pharmacoeconomic analyses. J Pain Palliat Care Pharmacother. 2002;16(4):65-69. doi:10.1080/j354v16n04_07
Johnson ST, Gosser RA, Kier KL, et al.. Formulary management challenges and opportunities: 2020 and beyond - an opinion paper of the drug information practice and research network of the American College of Clinical Pharmacy. JACCP. 2020;4:81–91.
American Hosital Association. Massive Growth in Expenses and Rising Inflation Fuel Continued Financial Challenges for America’s Hospitals and Health Systems. AHA. 2022. https://www.aha.org/guidesreports/2023-04-20-2022-costs-caring. Accessed October 2, 2023.
Badreldin HA, Atallah B. Global drug shortages due to COVID-19: Impact on patient care and mitigation strategies. Res Social Adm Pharm. 2021;17(1):1946-1949. doi:10.1016/j.sapharm.2020.05.017
Sen-Crowe B, McKenney M, Elkbuli A. Medication shortages during the COVID-19 pandemic: Saving more than COVID lives. Am J Emerg Med. 2021;45:557-559. doi:10.1016/j.ajem.2020.07.044
Kim LG, Thompson SG. Uncertainty and validation of health economic decision models. Health Econ. 2010;19(1):43-55. doi:10.1002/hec.1444
Frederix GW, van Hasselt JG, Schellens JH, et al. The impact of structural uncertainty on cost-effectiveness models for adjuvant endocrine breast cancer treatments: the need for disease-specific model standardization and improved guidance. Pharmacoeconomics. 2014;32(1):47-61. doi:10.1007/s40273-013-0106-x
Frederix GW, Haji Ali Afzali H, Dasbach EJ, Ward RL. Development and Use of Disease-Specific (Reference) Models for Economic Evaluations of Health Technologies: An Overview of Key Issues and Potential Solutions. Pharmacoeconomics. 2015;33(8):777-781. doi:10.1007/s40273-015-0274-y
Huygens SA, Versteegh MM, Vegter S, Schouten LJ, Kanters TA. Methodological Challenges in the Economic Evaluation of a Gene Therapy for RPE65-Mediated Inherited Retinal Disease: The Value of Vision. Pharmacoeconomics. 2021;39(4):383-397. doi:10.1007/s40273-021-01003-y
Burke L, Ryan A. The Complex Relationship between Cost and Quality in US Health Care. AMA Journal of Ethics. 2014;16(2):124-130. doi:10.1001/virtualmentor.2014.16.2.pfor1-1402
Keller B. PBMs Continue to Draw Federal Scrutiny: PBM Transparency Act of 2022. The National L Rev. 2023. https://www.natlawreview.com/article/pbms-continue-to-draw-federal- scrutiny-pbm-transparency-act-2022. Accessed October 2, 2023.
National Academy of State Health Policy. State Pharmacy Benefit Manager Legislation. NASHP. 2023. https://nashp.org/state-pharmacy- benefit-manager-legislation/. Accessed October 2, 2023.
DISCLAIMER
The information provided in this course is general in nature, and it is solely designed to provide participants with continuing education credit(s). This course and materials are not meant to substitute for the independent, professional judgment of any participant regarding that participant’s professional practice, including but not limited to patient assessment, diagnosis, treatment, and/or health management. Medical and pharmacy practices, rules, and laws vary from state to state, and this course does not cover the laws of each state; therefore, participants must consult the laws of their state as they relate to their professional practice.
Healthcare professionals, including pharmacists and pharmacy technicians, must consult with their employer, healthcare facility, hospital, or other organization, for guidelines, protocols, and procedures they are to follow. The information provided in this course does not replace those guidelines, protocols, and procedures but is for academic purposes only, and this course’s limited purpose is for the completion of continuing education credits.
Participants are advised and acknowledge that information related to medications, their administration, dosing, contraindications, adverse reactions, interactions, warnings, precautions, or accepted uses are constantly changing, and any person taking this course understands that such person must make an independent review of medication information prior to any patient assessment, diagnosis, treatment and/or health management. Any discussion of off-label use of any medication, device, or procedure is informational only, and such uses are not endorsed hereby.
Nothing contained in this course represents the opinions, views, judgments, or conclusions of RxCe.com LLC. RxCe.com LLC is not liable or responsible to any person for any inaccuracy, error, or omission with respect to this course, or course material.
© RxCe.com LLC 2023: All rights reserved. No reproduction of all or part of any content herein is allowed without the prior, written permission of RxCe.com LLC.